


Summary
C-suite executives often struggle with traditional dashboards that provide outdated insights. Monthly reports arrive long after the close of the period, while real-time dashboards drown them in granular data that masks strategic patterns.
Enter the GenAI Dashboard: a solution that bridges the gap by offering conversational, context-aware analytics in real time. The result? C-suite leaders become data-fluent decision-makers, operating at business speed, transforming strategic intelligence, and gaining a real-time competitive edge.
In over two decades of enterprise technology consulting, we’ve witnessed countless promises of “instant business intelligence.” From Executive Information Systems in the 90s to modern BI platforms, the reality remained unchanged: building executive dashboards required specialized developers, weeks of design iteration, and substantial IT investment.
Until now.
GenAI dashboard builder tools have fundamentally changed this equation. Today’s C-suite executives can describe their intelligence requirements in layman’s terms and watch as sophisticated, fully functional dashboards materialize in minutes, not months. This isn’t an incremental improvement. It’s a categorical shift in how enterprises operationalize strategic intelligence.
The business case is compelling: 80% of executives report needing better real-time analytics, yet only 30% trust their current data tools (Gartner). Meanwhile, data workers spend up to 60% of their time sifting through information rather than generating insights (Asana). AI dashboard generators address both problems simultaneously, accelerating intelligence delivery while improving decision confidence.
Get a Dashboard That Actually Gives You Insights in Real-time.
Contact Us
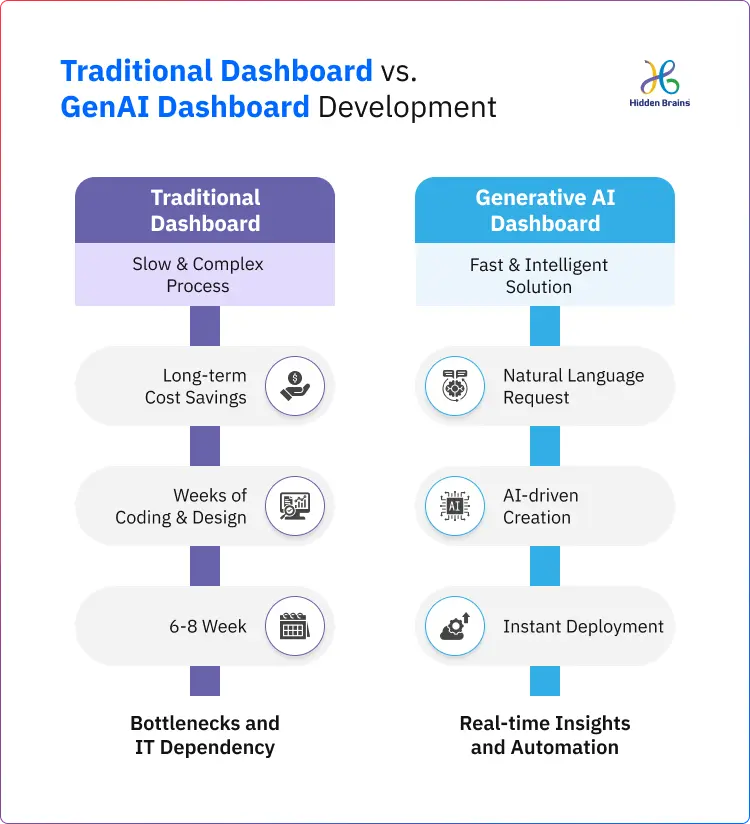
The Traditional Dashboard Development Bottleneck
Every experienced executive has lived this frustration: You need visibility into a critical business metric. You submit a request to IT. The response: “We can have that dashboard ready in 6-8 weeks.”
By the time the dashboard is delivered, beautifully designed, technically flawless, the strategic moment has passed. The market shifted. The competitive threat evolved. The decision was made based on incomplete information because waiting wasn’t an option.
This bottleneck comes from the basic limitations of traditional dashboard development.
The Technical Dependency Trap
Building dashboards in Tableau, Power BI, or Looker requires specialized skills. Your BI team becomes the intermediary between executive need and actionable intelligence. Request queues form. Priorities conflict. Strategic agility suffers.
The Specification Gap
Executives struggle to define dashboard requirements in technical terms. BI developers struggle to translate business needs into appropriate visualizations. Multiple review cycles become inevitable, extending timelines and increasing costs.
The Cost of Delay
Strategic opportunities are becoming shorter, competitive threats are speeding up, and customer preferences change quickly. However, intelligence systems are still stuck in long development cycles, creating a gap between the need for quick decisions and the ability to deliver data on time.
This delay comes at a high cost. Executives often make decisions without the best data support because the development time isn’t worth it. Over time, this leads to a competitive disadvantage.
How GenAI Dashboard Builders Fundamentally Change the Game
AI dashboard builder tools represent more than workflow optimization; they’re a reimagining of how intelligence infrastructure gets created and maintained.
The Conversational Build Process
Modern GenAI dashboard platforms enable executives to describe requirements in natural business language. The AI interprets intent, selects appropriate visualizations, connects relevant data sources, and generates fully functional dashboards, transforming what previously took weeks into minutes.
The Interaction Looks Straightforward
Executive: “Build me a dashboard showing Q4 cash flow projections, accounts receivable aging beyond 60 days, and our top customers by revenue risk. Break this down by geographic region with week-over-week trend comparisons.”
AI dashboard generator: Immediately processes the request, identifies required data sources (ERP, CRM, financial systems), determines optimal visualization types (waterfall charts for cash flow, heat maps for geographic distribution, trend lines for temporal analysis), and generates a complete dashboard ready for interaction.
No technical translation required. No specification documents. No development sprints. No waiting. This is how natural language processing development works.
This conversational approach eliminates the translation layer that historically slowed dashboard development. Executives think in business outcomes, not visualization types. GenAI dashboard tools bridge that gap automatically.
Intelligent Automation at Scale
The most sophisticated AI dashboard builder tools don’t just create visualizations; they intelligently connect to enterprise data sources, understand data relationships, and automatically configure appropriate joins and aggregations.
When a CEO requests “customer lifetime value analysis by acquisition channel,” the GenAI dashboard tool identifies required tables across CRM and financial databases, calculates CLV using appropriate formulas, segments by acquisition source, applies relevant time periods, and creates comparative visualizations, all without human intervention in the data pipeline. This level of automation can also be transformed into marketing insights with an AI Instagram carousel generator to share key metrics instantly with stakeholders.
AI-driven automation has been shown to improve data accuracy by 95% and reduce processing time by 80% compared to manual approaches. This accuracy improvement is particularly critical for C-suite dashboards where decisions carry significant financial and strategic consequences.
Real-time Adaptability
Unlike static traditional dashboards, AI dashboard generators continuously learn from usage patterns and business context. If an executive consistently drills down into specific metrics or adds custom filters, the AI proactively suggests related KPIs or predictive enhancements.
One financial services CHRO requested a dashboard tracking recruitment pipeline velocity. The GenAI dashboard system automatically suggested adding predictive time-to-fill estimates by role category, candidate quality scoring based on historical performance data, diversity metrics aligned with corporate objectives, and competitive offer analysis. All this is possible with custom AI development.
She didn’t request these enhancements. The AI identified them as contextually relevant based on her role, usage patterns, and industry best practices embedded in its training data.
Enterprise Impact: Where AI Dashboard Generators Deliver Measurable Results
Real-world deployments reveal consistent value creation patterns across industries, with documented outcomes demonstrating tangible business impact.
Retail: Customer Intelligence at Scale
Tesco, the UK-based retail giant, integrated AI-powered dashboards into its Clubcard loyalty program, serving over 20 million active users. The challenge was clear: traditional dashboards couldn’t deliver personalized intelligence at scale.
By implementing GenAI dashboard capabilities for real-time customer segmentation and behavior analysis, Tesco achieved remarkable results:
Documented Business Impact:
- 25% increase in customer engagement through AI-powered personalization.
- 17% increase in basket size driven by relevant product recommendations.
- 30% reduction in marketing waste through precision targeting.
- 15% improvement in inventory efficiency via smarter demand forecasting.
The strategic significance
This wasn’t an incremental improvement; it represented finding substantial revenue that existed within the customer base but remained invisible without AI-powered intelligence to identify and activate it.
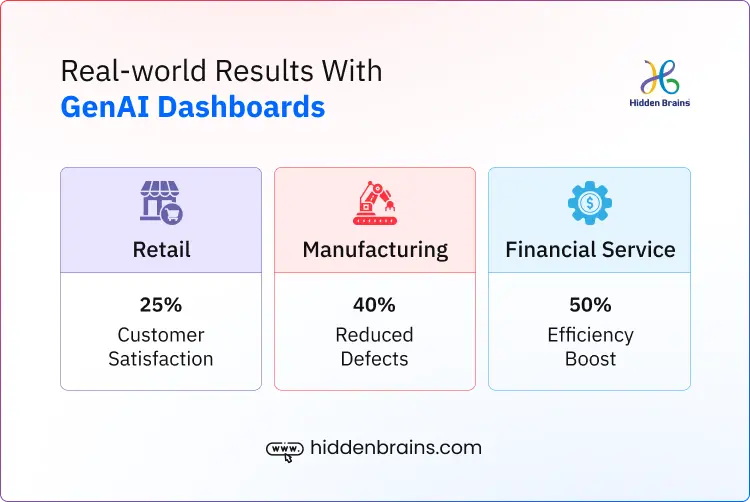
Manufacturing: Operational Excellence Through Real-time Visibility
Schaeffler, a global leader in precision manufacturing, deployed AI dashboard builder tools integrated with IoT sensors and real-time data streams across production lines. This enabled plant managers to create facility-specific operational intelligence dashboards.
Measured Outcomes:
- 40% reduction in defects through AI-driven inspection and anomaly detection.
- 30% decrease in downtime via predictive maintenance alerts.
- 20% operational cost savings through optimized material usage and energy efficiency.
The manufacturing director explained the strategic shift: “Previously, we identified problems after they impacted production. Now our GenAI dashboards flag microscopic anomalies before they cause defects or downtime. We’ve moved from reactive problem-solving to proactive prevention.”
The ability for plant managers to build custom dashboards without IT intermediaries proved equally valuable. When a quality issue emerged, managers built real-time monitoring dashboards in minutes to track specific parameters, enabling rapid root cause identification and resolution.
Financial Services: Regulatory Compliance and Risk Intelligence
Broadridge, serving the financial services industry, implemented GenAI dashboard capabilities for post-trade settlement operations. The challenge involved processing thousands of trades continuously while identifying potential settlement failures before they occurred.
Documented Impact:
- Up to 50% improvement in operational efficiency within T+1-impacted areas.
- Real-time anomaly detection enabling preventive intervention.
- Enhanced strategic agility through executive dashboards providing deep insights into Key Risk Indicators.
The financial services sector faces unique challenges, with 84% of business leaders citing security as a top AI adoption barrier (PwC). Broadridge addressed this through multi-layered governance frameworks grounded in data protection, model accuracy, and regulatory compliance, demonstrating that enterprise-grade GenAI dashboards require robust trust architectures.
Critical Success Factors for Enterprise Implementation
Success patterns across implementations reveal four critical factors that separate transformative deployments from disappointing ones.
Start with High-impact Use Cases
Organizations achieving fastest value realization begin with specific, high-value problems rather than enterprise-wide rollouts. The strategy: Identify strategic decisions currently delayed by lack of intelligence infrastructure, build those GenAI dashboards first, prove value quickly, then expand.
This focused approach builds organizational confidence in the technology while demonstrating tangible ROI. Once executives experience the difference between waiting weeks for intelligence versus generating it in minutes, adoption accelerates organically.
Ensure Data Foundation Quality
AI dashboard builder tools are only as effective as the data they access. Organizations with mature data governance, clear data ownership, and reasonable data quality achieve value substantially faster than those attempting to solve data problems and dashboard problems simultaneously.
The 95% improvement in data accuracy that AI-driven automation enables (McKinsey) assumes reasonably clean source data. If your data is fragmented or the quality is questionable, address foundational issues before implementing GenAI dashboard solutions.
Balance Democratization with Governance
The ease of AI dashboard generators creates new governance challenges. When anyone can build dashboards in minutes, organizations risk conflicting metric definitions, unauthorized data access, and decision-making based on poorly constructed analytics.
Successful implementations establish clear governance frameworks: approved data sources, certified metric definitions, role-based access controls, and dashboard review processes for enterprise-wide distribution.
Invest in Executive Adoption
Technology excellence doesn’t guarantee executive usage. C-suite leaders have established decision-making patterns and trusted intelligence sources. Displacing those requires demonstrating superior value quickly and repeatedly.
Effective adoption strategies include executive sponsors showcasing their GenAI dashboards in leadership meetings, communications highlighting business decisions enabled by the technology, and brief personalized training sessions that respect executive time constraints.
The 60% of the time data workers spend sifting through information (Asana) represents an opportunity cost that resonates with C-suite leaders. Framing AI dashboard builders as time liberation drives adoption more effectively than technical capability demonstrations.
The Strategic Need
The competitive landscape is creating a growing gap between organizations with flexible intelligence systems and those stuck with rigid BI setups. Market volatility, regulatory challenges, and increasing competition are speeding up, while strategic opportunities are shrinking.
The organization that can build required intelligence in minutes holds a decisive advantage over competitors requiring weeks. During recent supply chain disruptions, companies with AI dashboard generator capabilities could build supplier risk assessment dashboards, inventory buffer analysis, and alternative sourcing intelligence in hours, not weeks.
This timing advantage translated directly into preserved revenue and avoided costs.
Three critical questions every C-suite executive should ask:
- How many strategic decisions were delayed in the past quarter due to a lack of timely intelligence? If the answer exceeds zero, you have a dashboard development bottleneck constraining business agility.
- What percentage of executive intelligence requests can your BI team fulfill within one week? Organizations with GenAI dashboard platforms can fulfill the majority within hours rather than weeks.
- Can your business intelligence infrastructure adapt as fast as your market changes? If not, you’re making increasingly critical decisions with decreasingly relevant intelligence.

Ready to Explore The Power of Generative AI For Your Business?
Book Personalized DemoHow Hidden Brains Can Help?
With over 2,400 businesses served, including Fortune 500 companies, Hidden Brains has successfully completed 6,000+ projects, specializing in AI-powered dashboard solutions that drive business transformation.
Our Expertise:
- Tailored AI Dashboards: Custom-built to integrate seamlessly with your systems, offering predictive insights and real-time data.
- Proven Impact: We deliver 25% engagement increases, 40% defect reductions, and 50% efficiency improvements across industries.
- End-to-end Services: From consultation to integration and support, we ensure your solution evolves with your needs.
Frequently Asked Questions
What are the main benefits of using GenAI dashboard tools for executives?
GenAI dashboards provide real-time insights, improve decision-making confidence, and eliminate bottlenecks in data access, enabling faster, data-driven decisions with minimal reliance on IT and BI teams.
How does the AI interpret business language to create dashboards?
GenAI dashboard platforms use natural language processing (NLP) to understand business requirements in plain English, select appropriate visualizations, connect relevant data sources, and generate dashboards without the need for technical translation.
What makes GenAI dashboards different from traditional BI tools like Tableau or Power BI?
GenAI dashboards eliminate the need for manual development cycles, complex integrations, and multiple review stages. They offer a conversational, automated approach to building customized dashboards, significantly reducing time and complexity.
Can GenAI dashboards integrate with existing enterprise data systems?
Yes, GenAI dashboard tools integrate seamlessly with existing enterprise data systems like CRM, ERP, and financial databases, enabling automated data retrieval and visualization without manual intervention.
How do GenAI dashboards improve business efficiency?
By automating the dashboard creation process and providing real-time data insights, GenAI dashboards reduce the time spent on data wrangling and manual reporting, leading to faster decision-making and increased operational efficiency.
Are GenAI dashboards secure and compliant with industry standards?
Yes, GenAI dashboards incorporate robust security features, including data encryption, role-based access controls, and compliance with data protection regulations, ensuring that your business intelligence remains secure.
How do GenAI dashboards adapt over time?
GenAI dashboard tools continuously learn from user behavior, usage patterns, and business context. They proactively suggest related KPIs, predictive metrics, and enhancements to improve the relevance and usefulness of the dashboards.
How can Hidden Brains help my organization implement GenAI dashboards?
Hidden Brains specializes in custom AI dashboard solutions, providing end-to-end services from consultation to integration and ongoing support. We ensure your dashboards are tailored to your business needs, helping you achieve measurable results like increased engagement, reduced defects, and improved efficiency.
How can I get started with GenAI dashboards for my business?
You can book a personalized demo with Hidden Brains to explore the power of GenAI dashboards and see how they can transform your business intelligence infrastructure.


Conclusion
GenAI dashboard builders represent the most significant advancement in executive intelligence infrastructure in decades. The barrier between executive need and actionable intelligence has collapsed from weeks to minutes. The technical skills gap between business leaders and dashboard creation has disappeared.
Organizations embracing AI dashboard generators aren’t simply improving efficiency; they’re fundamentally changing how fast they can identify opportunities, assess risks, and execute strategy. The competitive question is no longer whether this technology works; the evidence is definitive. The question is whether your organization will be among the leaders capturing first-mover advantages or if it’s still questioning or struggling to catch up.
The choice, and the window to choose, are both narrowing.